Electricity Dispatch Model

By Alan Jenn

In the United States, the transportation sector consumes approximately five billion barrels of oil annually and accounts for nearly a third of greenhouse gas emissions. The potential climate impacts of the transportation sector have facilitated a transition towards cleaner, alternative fuel vehicles such as electric vehicles (EVs)—touted as “zero-emission” vehicles. Policies like the Zero Emissions Vehicle (ZEV) mandate in California and incentives such as the federal Plug-In Electric Vehicle Credit (IRC 30D) have accelerated the transition. However, if the ultimate goal of the transition is to create a cleaner transportation system, a proper accounting of emissions is necessary to understand the true impact of EVs.  We constructed a nationwide electricity dispatch model based on outputs from the Environmental Protection Agency’s (EPA) Integrated Planning Model (IPM) used in the assessment of the Clean Power Plan (CPP).  Using future projections of EV sales as well as a number of scenarios for charging behavior, it is possible to capture a profile of electric vehicle emissions on the sub-state level and importantly across a lengthy time span from 2016 through 2040.
Electricity Dispatch Model Figure 1
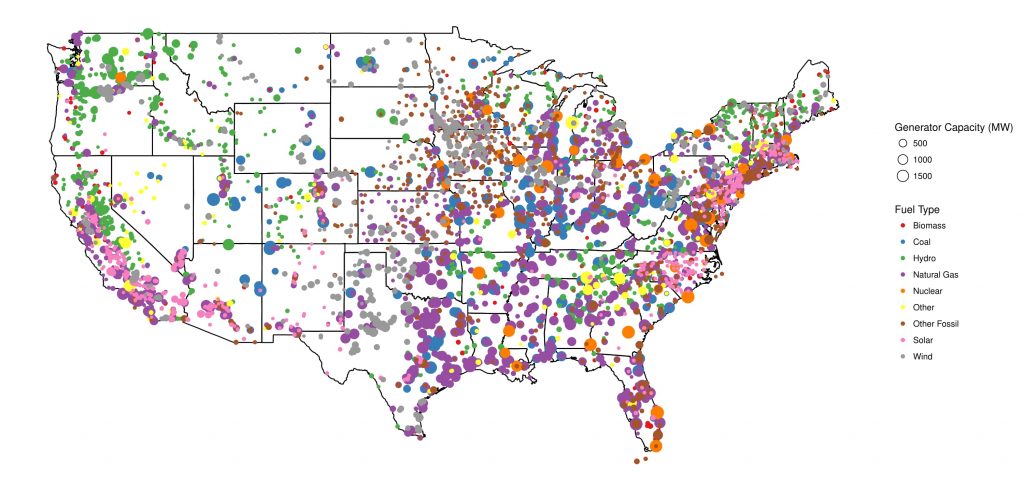
Figure 1. Generation capacity by fuel type and size of generators across the United States in 2016.
Electricity Dispatch Model Figure 2
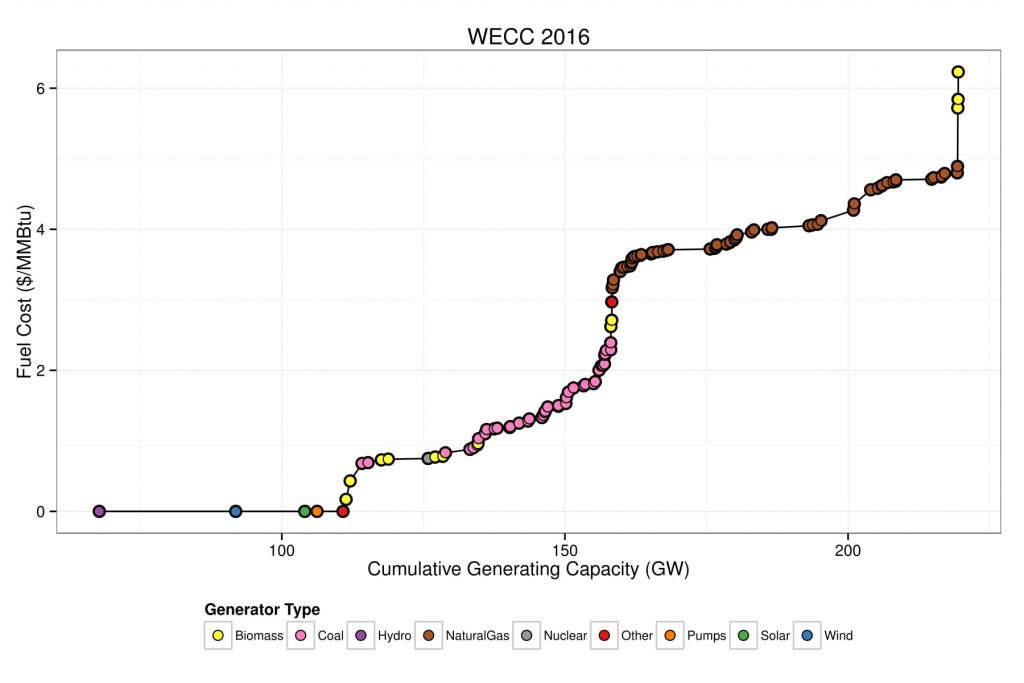
Figure 2. Economic dispatch curve of aggregated power generators on the electric grid on the basis of fuel cost and type. This particular dispatch curve is for all generators located in the WECC region in 2016. To meet electricity demand, generators with lower costs are dispatched first. As demand increases, more sources of electricity are included and the cumulative generating capacity increases.


Electricity Dispatch Model Figure 3
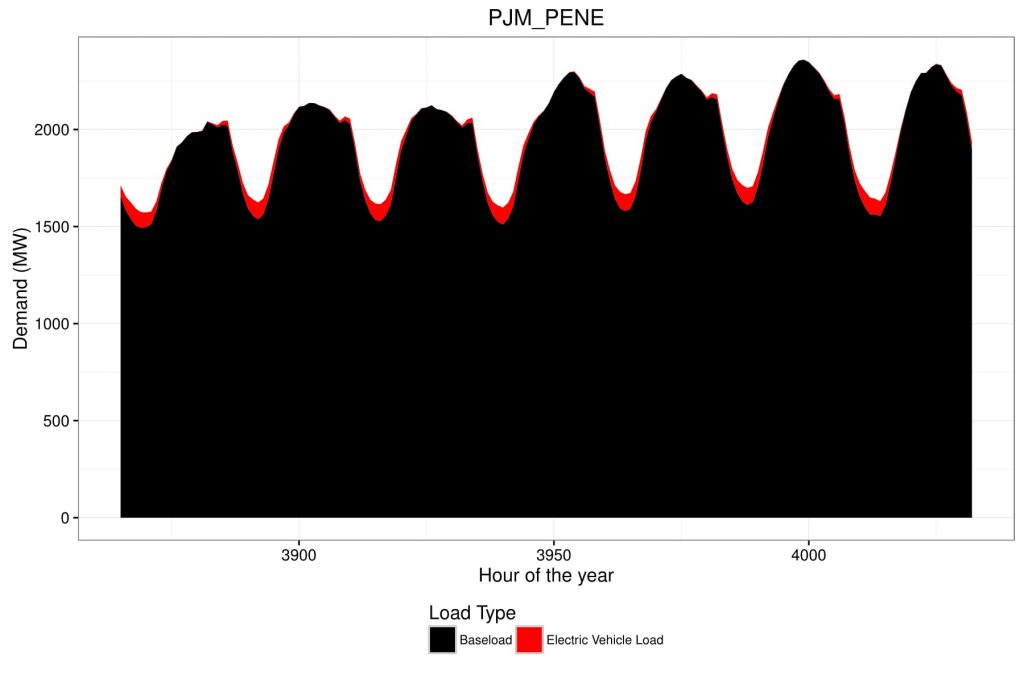
Figure 3. Total electricity demand resulting from baseline demand (black) plus the electric vehicle load demand (red) from the EV load simulation. The aggregate demand represents load in 2025 in Western Pennsylvania.


Electricity Dispatch Model Figure 4
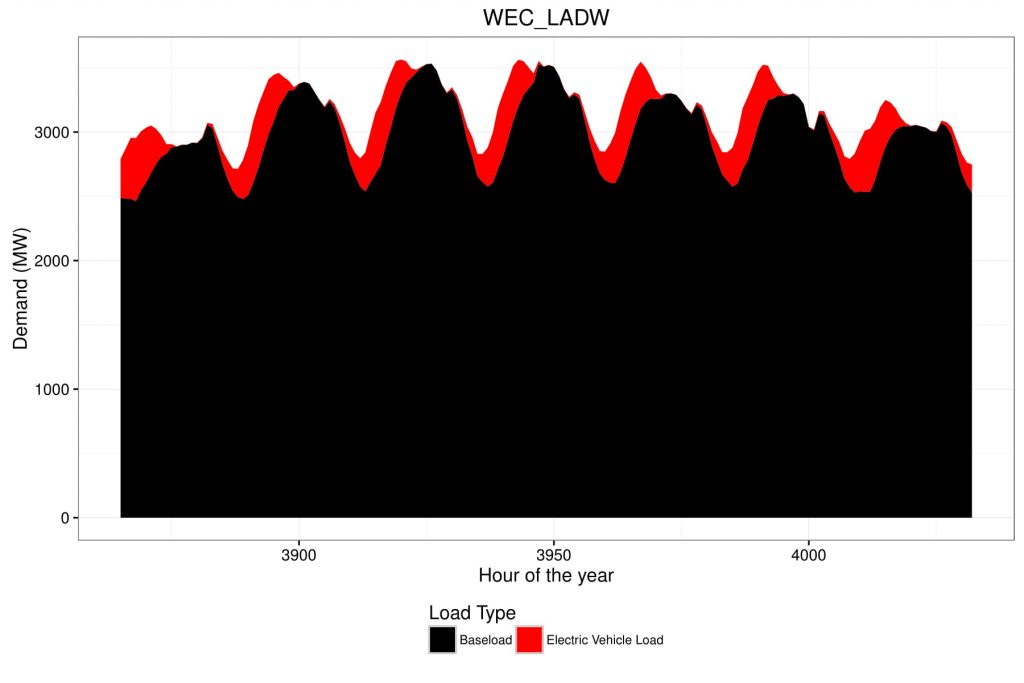
Figure 4. Total electricity demand resulting from baseline demand (black) plus the electric vehicle load demand (red) from the EV load simulation. The aggregate demand represents load in 2025 in the greater Los Angeles region.


Electricity Dispatch Model Figure 5
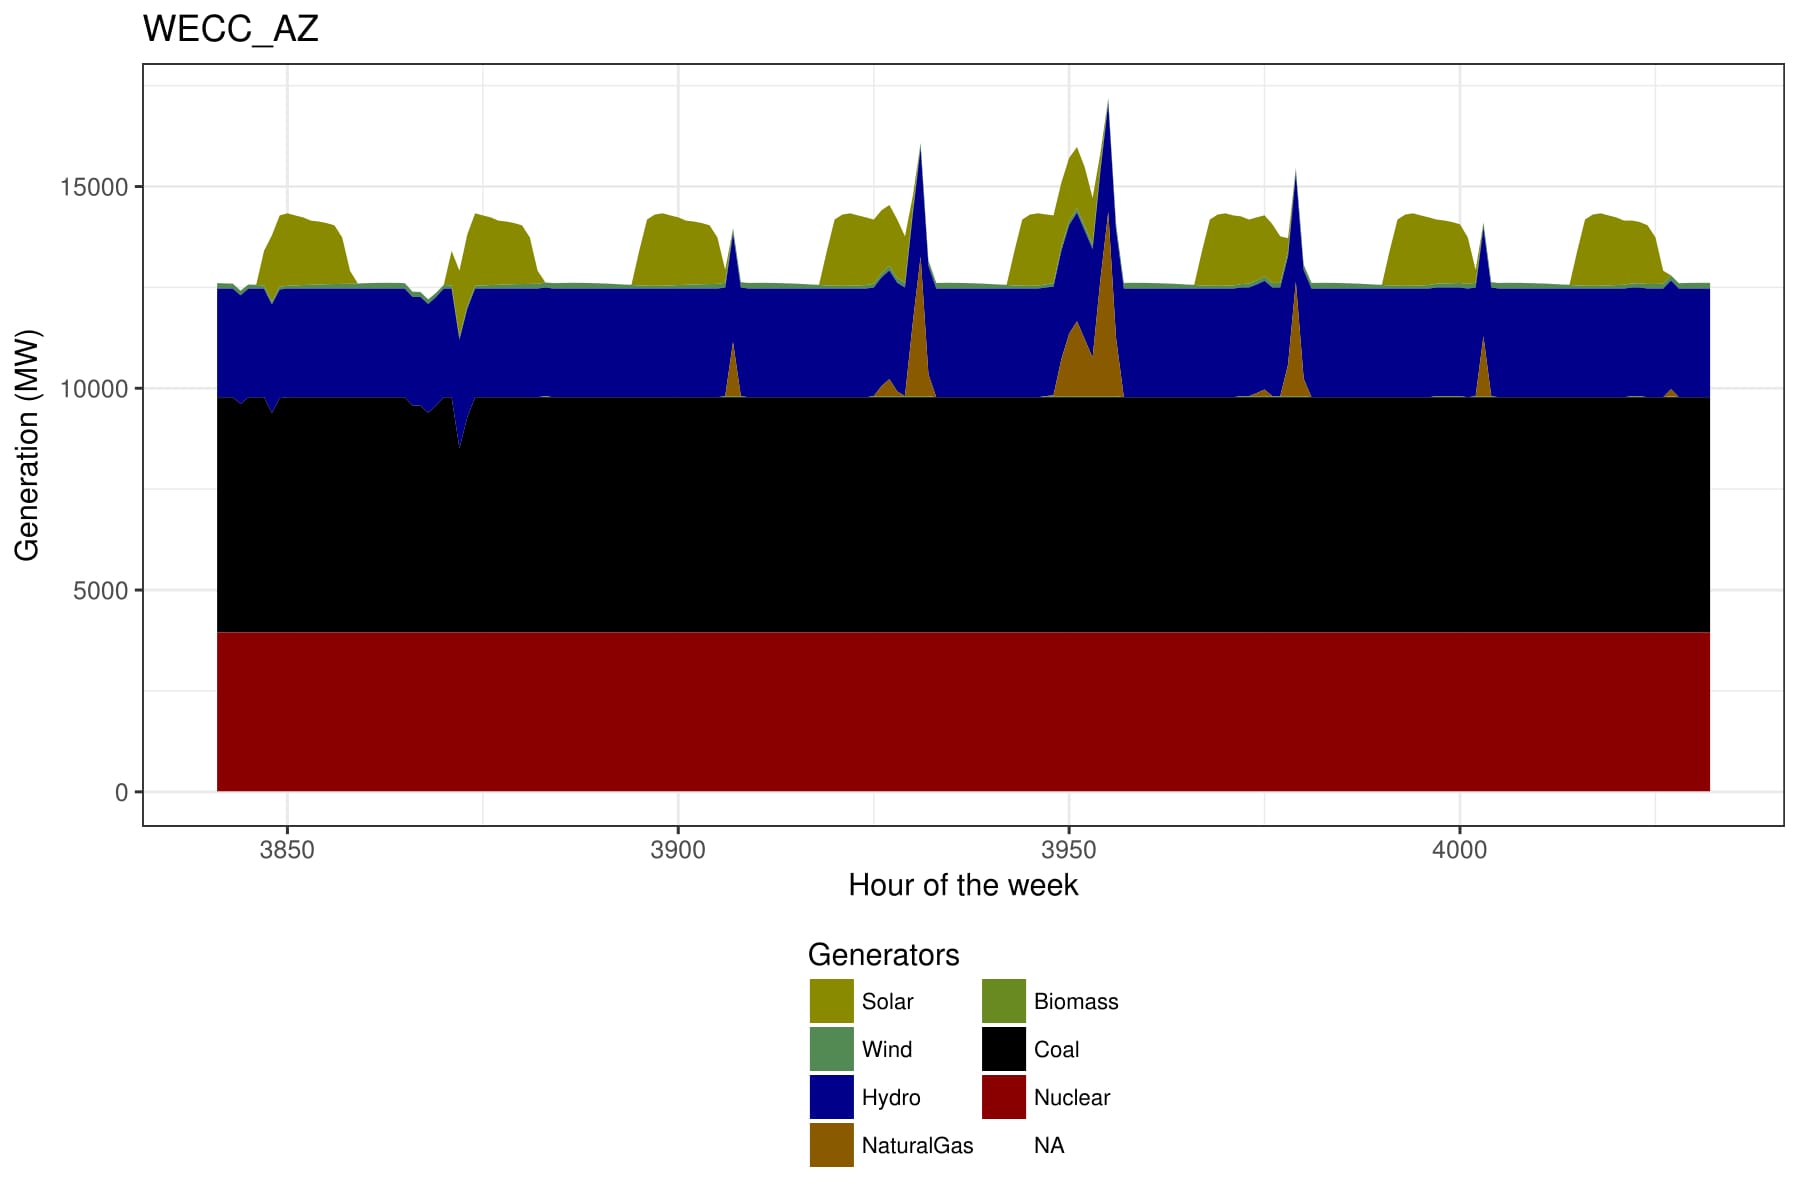
Figure 5. Economic dispatch generation results over a week period in Arizona in 2025. This particular dispatch shows a baseline generation primarily consisting of nuclear and coal generation. Flexible uptake is provided from a combination of solar power and natural gas.


Project Status
Complete

Project Type